Data Visualization: Two Weeks of Texting
Previous
Next
DATA VISUALIZATION


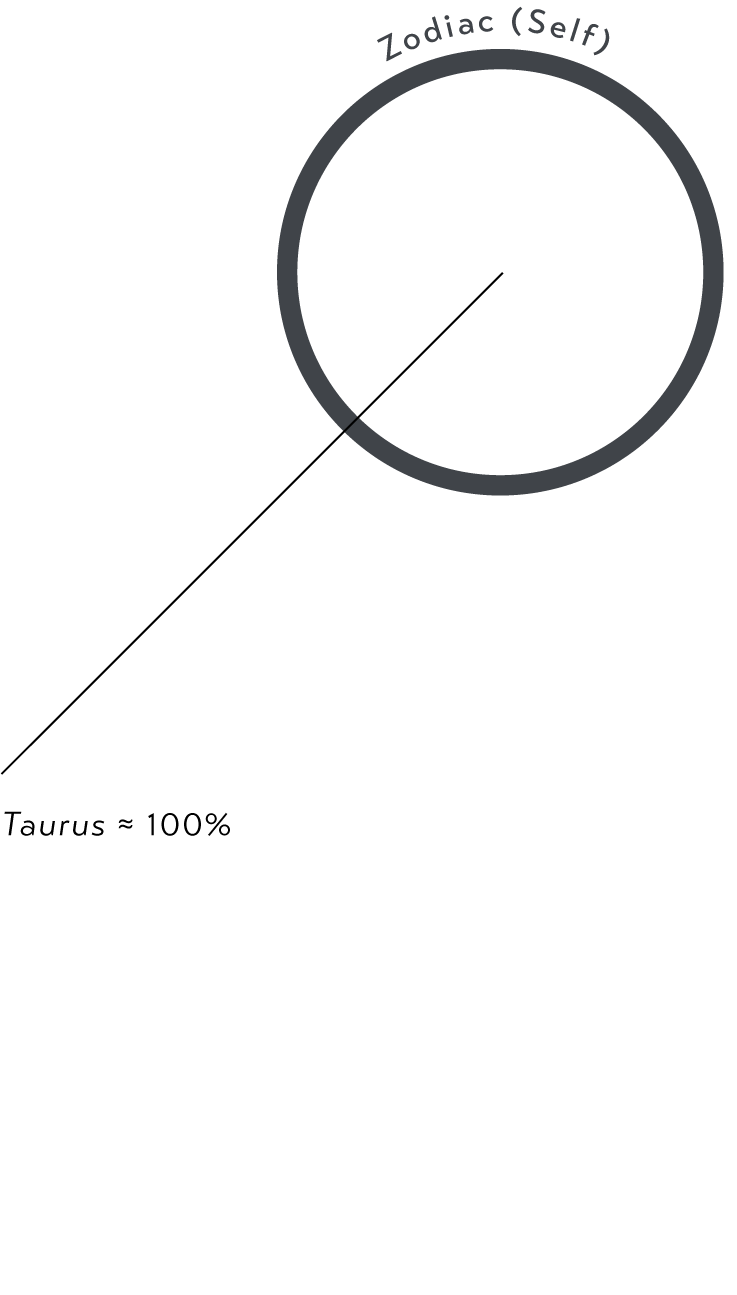
This data visualization focuses was 2 weeks of text messaging, dissecting the variables behind each digital interaction. Upon collecting all of the data, there were a group of 31 people and 1,077 texts to analyze. I looked at elements of each person’s identity, as well as, the circumstances behind each act of communication. Each segmented chart is broken down into percentages and showcases height variations to depict quantity. The purpose of this data analysis was to look at communication styles and discover more about myself in that realm.


